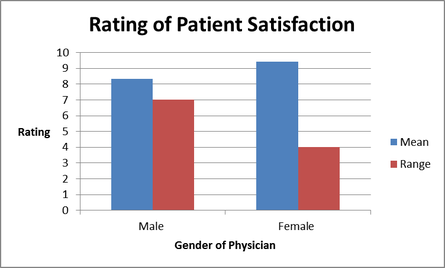
The mean was used to demonstrate the average rating of the patient satisfaction on the scale. The range was used to represent the whole data including the outliers to more accurately depict the extent of the patient satisfaction. The picture on left shows the mean of the rating the participants gave, the overall mean was larger with female physicians. Furthermore, the range of Male physician was much larger than female Physician.
I chose the Mann-Whitney U test because the data was ordinal and an independent sample, it ultimately allows two conditions to be compared without making the assumption that values are normally distributed. It was one-tailed because a direction for the results was predicted. The number of participants was 30, the P value is 0.03144 and the critical value of U was 68. Therefore, the results are significant at P≤ 0.005. The probability of getting these results by chance or random error was than 0.5%. I will not accept my Ho because P is lower than 0.05, thus it is a significant figure.
